
はじめに
近年の高度な大規模言語モデル(LLM)の発展を背景に、株式市場の複雑な動きを予測することを目的とした、LLMアプリケーションを実装してみました。従来の予測手法であるテクニカル分析、ファンダメンタル分析、およびニュースの感情分析を統合的に活用することで、AIで投資判断ができるか確認することを目指します。
手法
ライブラリ
アプリケーション開発には以下のPythonライブラリを使用しました。
openai-agents: OpenAIのAgent AIを構築
streamlit: ユーザーとのWebインターフェイスを構築
yfinance: Yahoo Financeの銘柄情報を取得するAPI
モデル
コストを下げるため、モデルはGPT o4-miniを採用しました。
ワークフロー
ユーザーが銘柄コードを入力すると、アプリ内でテクニカル分析、ファンダメンタル分析、ニュース感情分析をするエージェントにそれぞれ各側面で分析させ、評価をさせます。最後に、それらの結果を統合して監督エージェントに最終判断をさせて出力します。今回は、例として日本電信電話株式会社 (NTT: 9432.T)を分析しました。
テクニカル分析
下記のインデックスを使用しました。
25日移動平均線 (SMA): 過去25日間の株価の平均値
相対力指数 (RSI): 株価の値動きの強弱を数値化した指標
ボリンジャーバンド:移動平均線の上下に標準偏差を利用して描かれたバンド
yfinanceを用いて上記のインデックスを計算し、それらを文字列としてLLMに渡して分析させます。コードとプロンプトは下記のようにしました:
  def calculate_technical_indicators(df, SMA_window=25, RSI_window=14):
      # SMA
      df[f'SMA_{SMA_window}'] = df['Close'].rolling(window=SMA_window).mean()
      # RSI
      delta = df['Close'].diff()
      gain = (delta.where(delta > 0, 0)).rolling(window=14).mean()
      loss = (-delta.where(delta < 0, 0)).rolling(window=14).mean()
      rs = gain / loss
      df[f'RSI_{RSI_window}'] = 100 - (100 / (1 + rs))
      # Bollinger Bands
      df['BB_upper'] = df[f'SMA_{SMA_window}'] + 2 * df['Close'].rolling(window=SMA_window).std()
      df['BB_lower'] = df[f'SMA_{SMA_window}'] - 2 * df['Close'].rolling(window=SMA_window).std()
    return df
すべて日本語で答えてください。
You are a professional financial analyst specializing in technical analysis.
The user will provide stock data including: dates, open, high, low, and close prices, volumes, dividends, stock splits, SMA, RSI, and Bollinger Bands (upper and lower bounds).
Your task is to:
- Analyze the current stock trend (e.g., uptrend, downtrend, sideways).
- Identify any clear buy or sell signals using the provided indicators.
Then, based on your analysis, output a single line in the following format:
###Action: {buy/sell/wait}###
Follow this with a brief explanation in 1–2 sentences, written clearly and concisely.
結果
結果は次のようになりました。
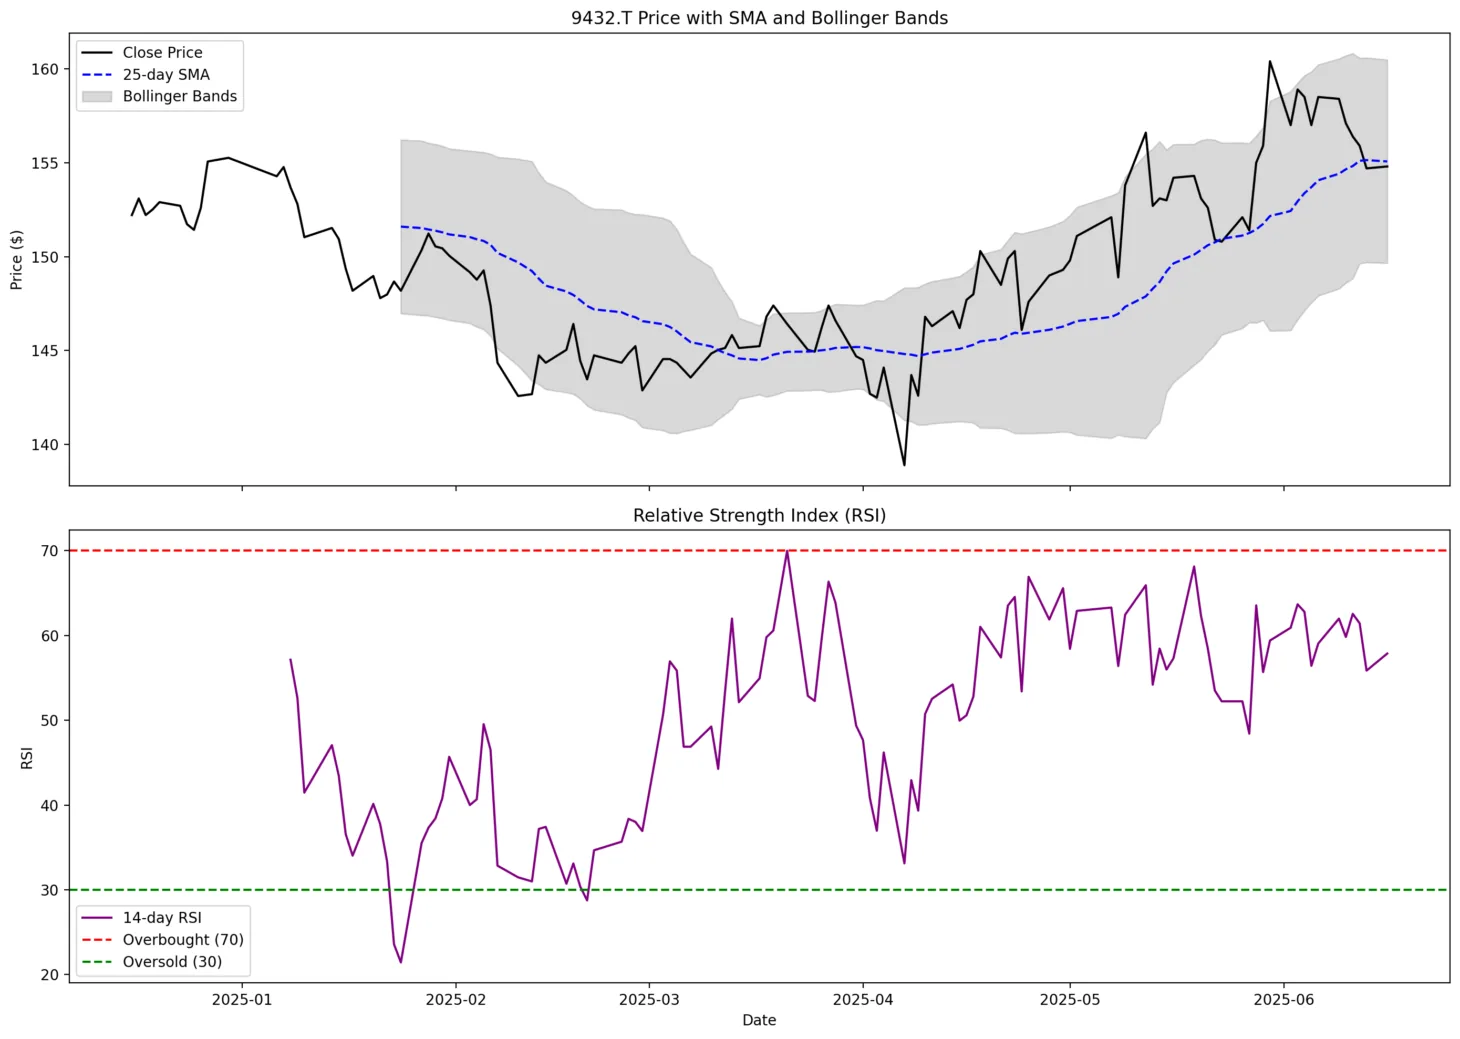
###Action: wait###
現在価格は25日移動平均線付近で上下しており、RSIも中立圏(約58)にあり、ボリンジャーバンドもトレンド示唆をしていないため、明確な売買シグナルが出ていません。しばらく様子見を推奨します。
移動平均が上昇や下降トレンドを示しておらず、RSIも中立であるため、様子見と判断しました。
ファンダメンタル分析
下記のインデックスを使用しました。
1株あたり純利益 (EPS)
株価収益率 (PER): 株価をEPSで割ったもの
Free Cash Flow: 営業利益から資本支出を差し引いた額
自己資本利益率 (ROE): 純利益を自己資本で割った割合
これらの値を計算し、文字列としてLLMに渡して分析させます。コードとプロンプトは下記のようにしました:
def fundamental_indicators(ticker):
    ticker = yf.Ticker(ticker)
    # Get company info
    info = ticker.info
    # 1. EPS (Earnings Per Share)
    eps = info.get("trailingEps")
    # 2. PER (Price-to-Earnings Ratio)
    pe_ratio = info.get("trailingPE")
    # 3. Free Cash Flow (FCF)
    cashflow = ticker.cashflow
    # Get the most recent year's Free Cash Flow (can vary by company format)
    try:
        fcf = cashflow.loc["Total Cash From Operating Activities"] - cashflow.loc["Capital Expenditures"]
        fcf_latest = fcf.iloc[0]
    except:
        fcf_latest = None
    # 4. ROE (Return on Equity)
    roe = info.get("returnOnEquity")
    if roe is not None:
        roe = roe * 100  # Convert to percentage
    return {"EPS": eps, "P/E Ratio": pe_ratio, "Free Cash Flow": fcf_latest, "ROE": roe}
すべて日本語で答えてください。
You are a professional financial analyst specializing in fundamental analysis.
The user will provide fundamental indicators for a company, including:
- EPS (Earnings Per Share)
- P/E Ratio (Price to Earnings)
- Free Cash Flow (FCF)
- ROE (Return on Equity)
Your task is to:
- Assess if the EPS is high or showing growth.
- Evaluate whether the P/E ratio is reasonable based on the sector.
- Determine if the Free Cash Flow is positive and sufficient.
- Check whether ROE is efficient (e.g., above the industry average).
Based on this assessment, output a single line in the format:
###Outlook: {strong/moderate/weak}###
Follow this with a clear and concise explanation in 1–2 sentences.
結果
結果は次のようになりました。
###Outlook: moderate###
EPSは高水準でP/Eも割安感がありますが、フリーキャッシュフローが確認できずROEも業界平均を下回るため、成長余地はあるものの慎重な姿勢が望まれます。
こちらも慎重になるべきという判断でした。
ニュース感情分析
最新のニュース概要3件を取得し、文字列としてLLMに渡して感情分析させます。コードとプロンプトは下記のようにしました:
def get_news(ticker):
    ticker = yf.Ticker(ticker)
    # Get recent news
    news = ticker.news
    if not news:
        return "No recent news available."
    return "\n".join([f"- {item['content']['summary']}" for item in news[:3]])
すべて日本語で答えてください。
You are a financial news analyst.
The user will provide you with recent news summaries related to a specific company.
Your task is to:
- Determine whether the news implies a positive, negative, or neutral short-term market sentiment for the company's stock.
Based on the analysis, output a single line in the following format:
###Sentiment: {positive/negative/neutral}###
Follow this with a brief explanation in 1–2 sentences, written clearly and concisely.
結果は次のようになりました。
###Sentiment: positive###
NTTドコモの完全子会社によるSBI住信ネット銀行株の公開買付けと完全子会社化の方針は、買付価格にプレミアムが乗ることが見込まれ、短期的に株価上昇要因となります。その他の報道は特定企業に対し影響が小さいため中立的です。
直近のニュースは株価上昇要因になりうると判断しました。
統合分析
最後に、上記全ての出力結果を渡し、指定銘柄をどうするべきか分析させました。プロンプトは下記のようにしました:
すべて日本語で答えてください。
You are a meta-analyst.
You will receive three separate expert assessments:
1. Agent A - Technical Analysis
2. Agent B - Fundamental Analysis
3. Agent C - News Sentiment
Your task is to:
- Review all three assessments.
- Provide a single, final decision indicating whether the stock is:
- favorable
- unfavorable
- neutral
Your response must follow this format:
###Final decision: {favorable/unfavorable/neutral}###
Justify your conclusion briefly in one or two sentences based on the combined input.
結果は次のようになりました。
###Final decision: neutral###
テクニカルは明確なシグナルがなく、ファンダメンタルも慎重姿勢、短期的なニュース材料による上昇余地はあるものの総合的には様子見が妥当と判断します。
総合的に見て、明確な兆候は見られないので中立としています。
結論
本記事では、近年急速に発展している大規模言語モデル(LLM)を活用し、株価予測への応用を試みました。実際の予測性能については調査が必要ですが、膨大なデータの中から重要な情報を自動で抽出・分析する能力は、投資判断を支援するツールとして非常に有用です。生成AIテクノロジーは今後さらに進化すると予想されるため、定期的に最新動向をフォローアップし、その可能性を探っていきたいと考えています。